Contents
Overview
The economy is the foundation of every strategy. Regions have population, infrastructure and buildings; buildings turn goods into other goods; a shared world market sets prices every week. Together they produce GDP, taxes and, in the end, stability.
Population and work
Population is simulated per region. Part of it is in the labour force; buildings hire first, the rest works in services or is unemployed. New buildings therefore lower unemployment – until the labour force is used up. After that, workers are missing and become the limiting factor.
The population has needs in three tiers: basic, comfort and luxury. As prosperity grows, comfort and luxury demand rise. How well needs are met affects stability and – if basic needs are missing – population growth.
Buildings and production methods
Buildings stand in levels in the regions. Every building has switchable production methods that research unlocks: a steelworks from the year 2000 is not torn down but modernised. This way epoch transitions run through the economy without buildings losing their identity.
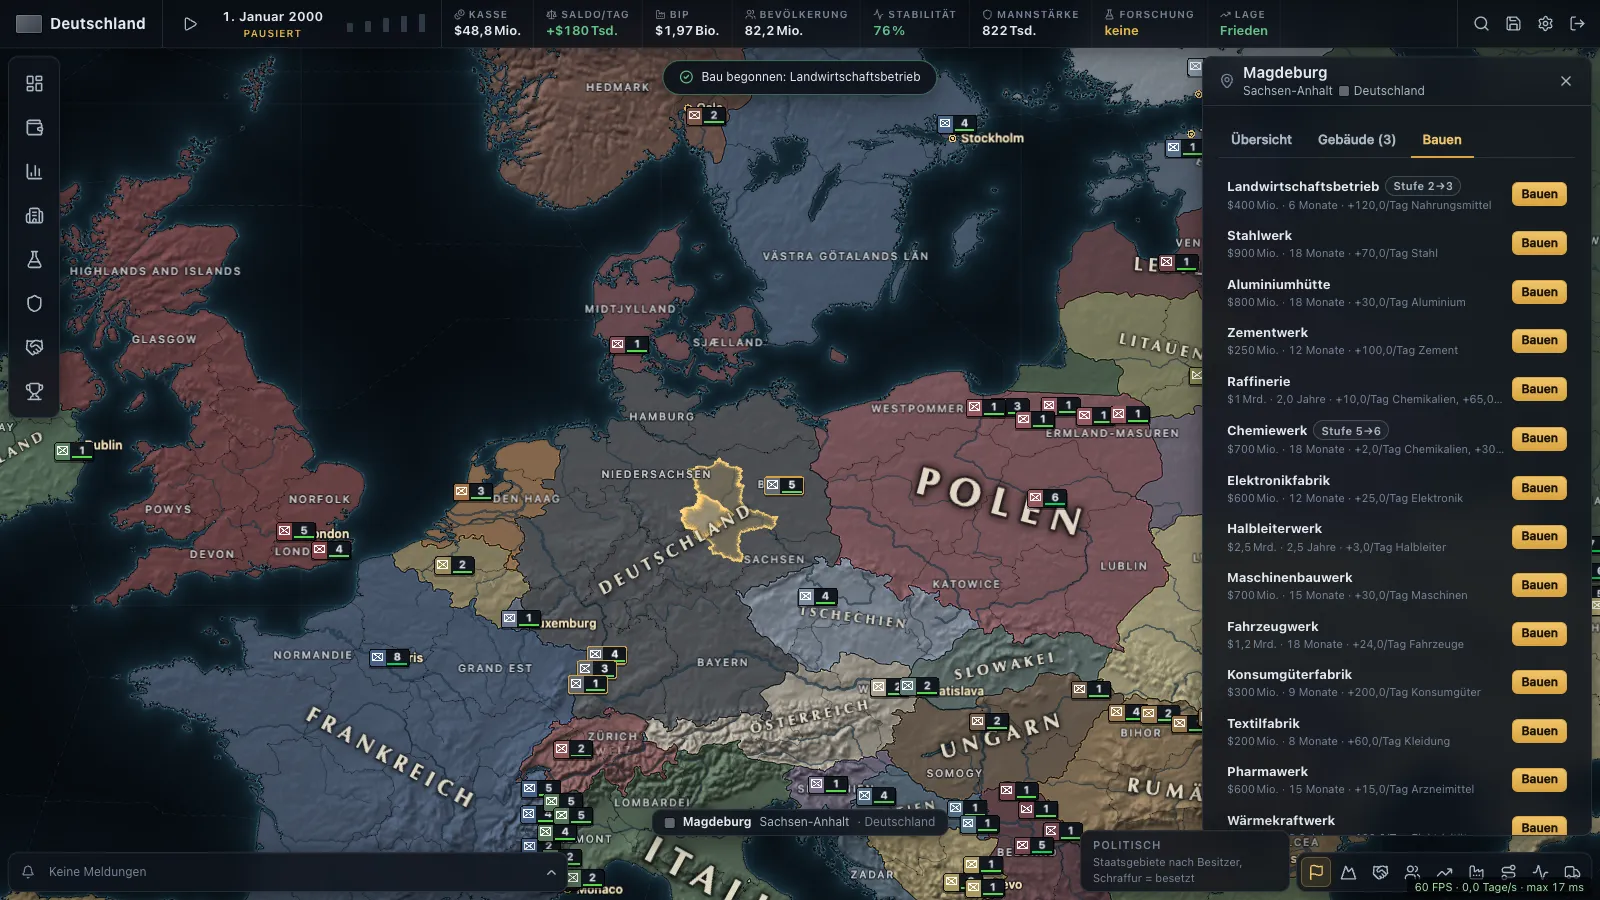
You build from a region's detail panel; costs are paid when the project starts. How many projects run in parallel depends on the size of the economy – large states build in many places at once, small ones one after another.
The limiting factor
Every factory shows in the detail panel what currently limits its output: missing workers or a missing input (such as “fuel”). Output also depends on the region's infrastructure and stability.
For experts: the production formula
The limiting reason is factor.workforce or factor.input.<good> – whichever of the two factors is smaller. Utilisation varies with the business cycle between 0.7 and 1.1. Stocks can never become negative.
Markets and prices
Every nation keeps its own stocks. For trade there is a shared world market on which actors outside the map (such as the USA and China in the start region) also trade. Automatic trade keeps a stock buffer per good: below it the nation imports, far above it exports. Your own trade orders in the market (F3) override the automation.
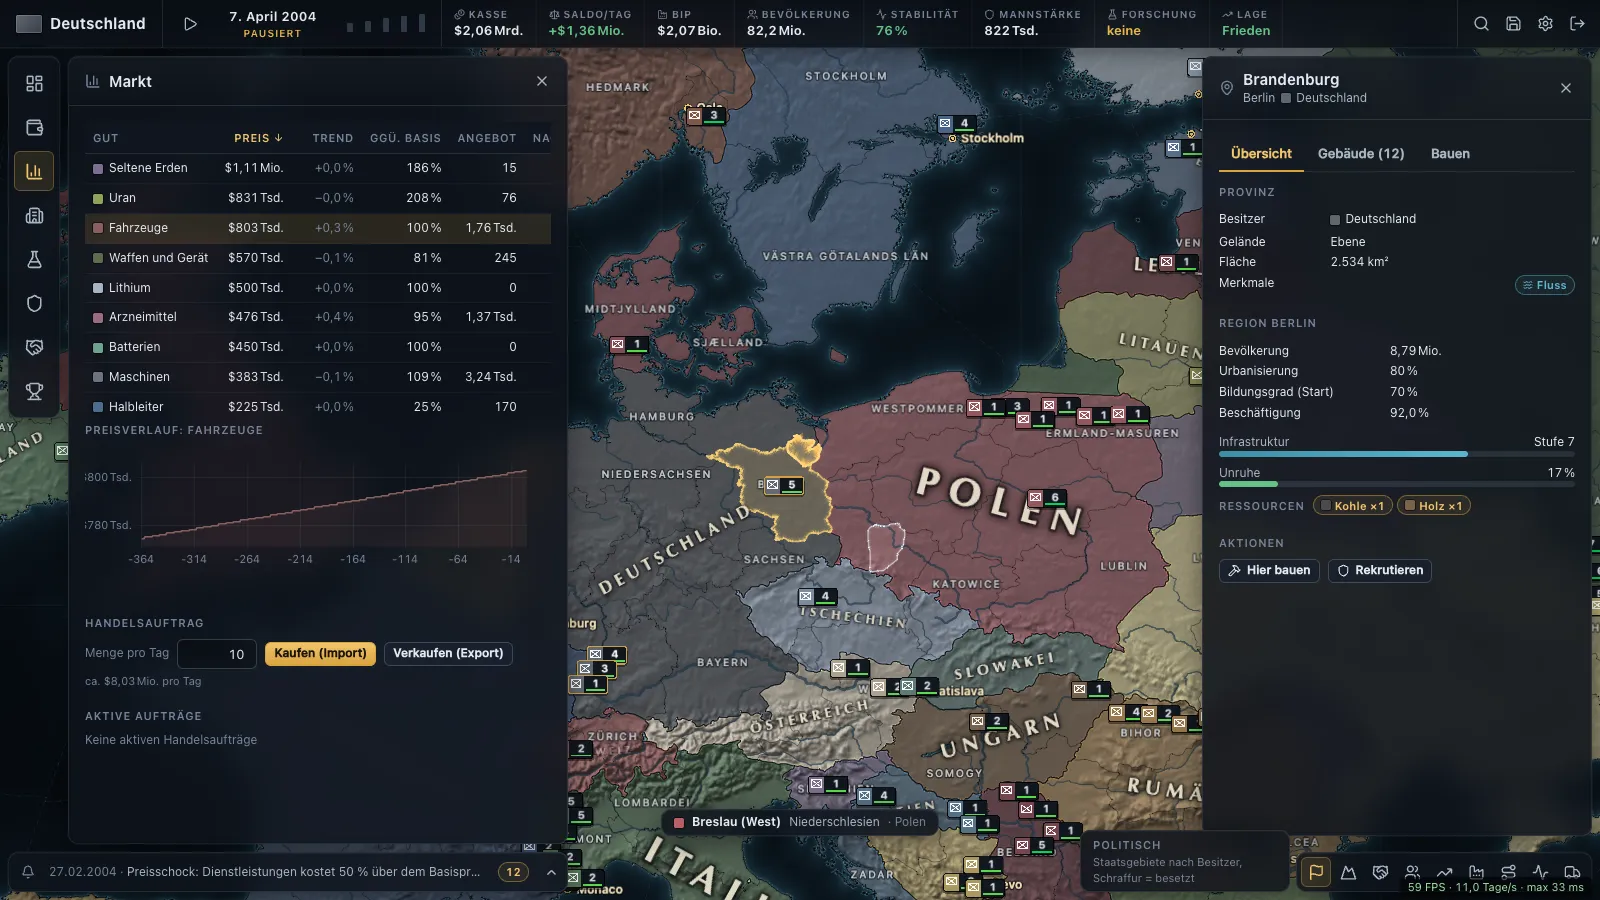
World market prices form weekly from supply and demand. Lasting imbalances move prices slowly, sudden shocks – an embargo, a war, a supply outage – strongly. When prices cross a threshold, the affected nations report a price shock.
Exponents and speed are defines from Spec 20 §6 and §14.
Budget and debt
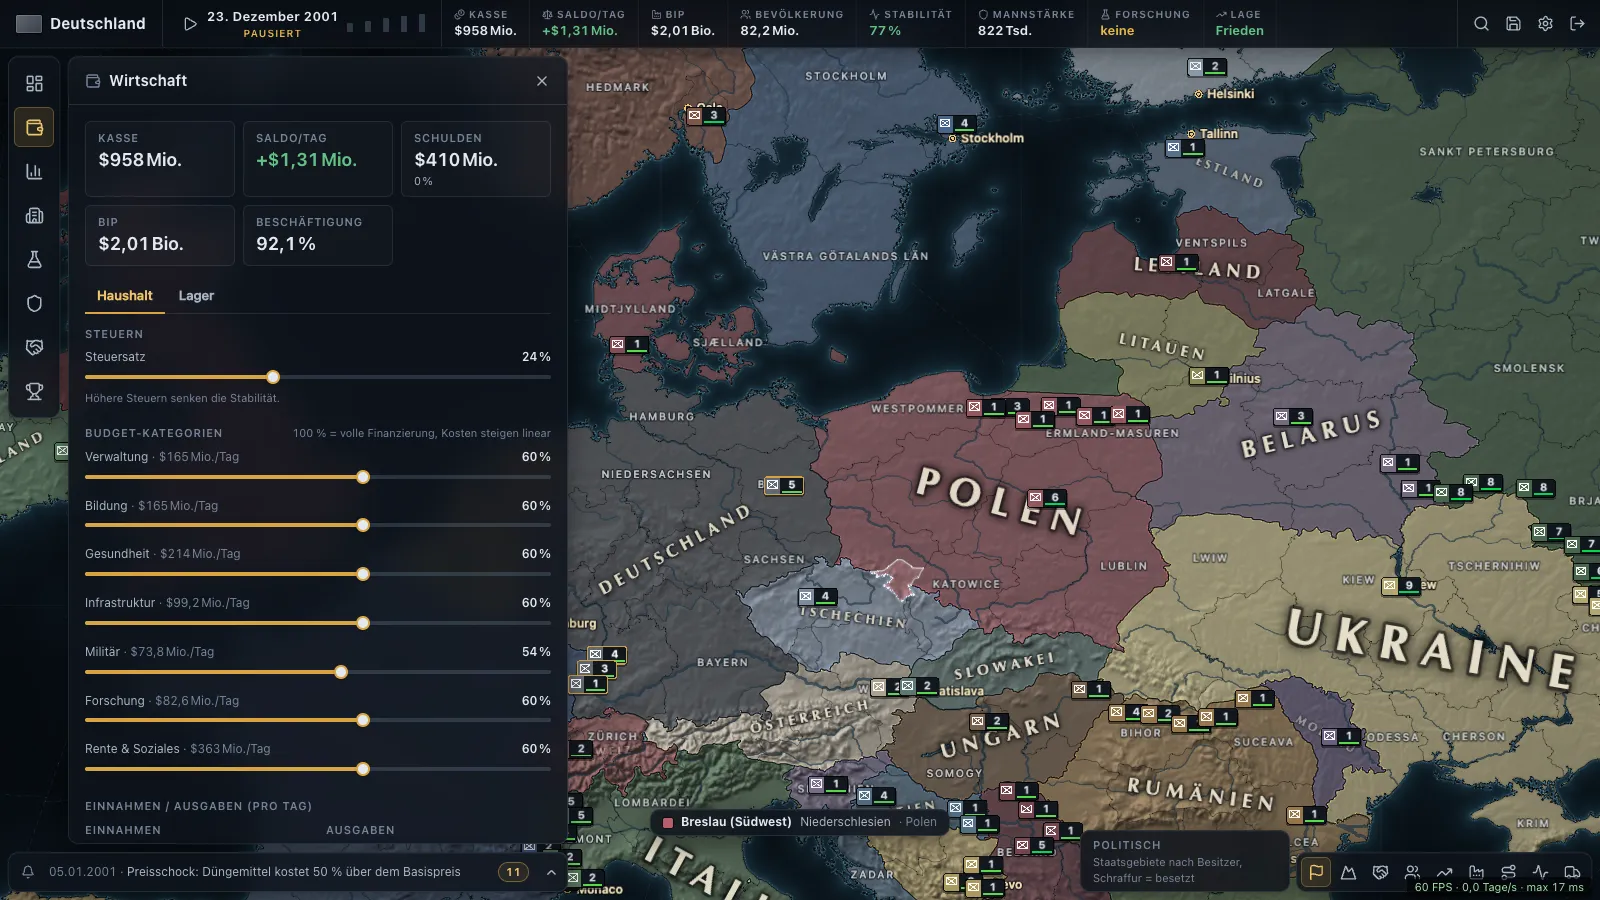
Revenue comes mainly from taxes (tax rate × GDP × tax efficiency) and tariffs. You distribute spending across budget categories: administration, education, health, social, research, military, infrastructure – plus troop upkeep, interest and construction. Higher taxes bring money but cost stability.
If money runs short, the state borrows. The interest rate rises with the debt ratio and the deficit; in a debt crisis refinancing becomes expensive. Above a debt ratio of 200 %, state bankruptcy with a haircut and a loss of stability looms (default values from Spec 20 §14).
Crises that emerge on their own
Banking crises are not on a calendar. They emerge when private debt has built up over years and a trigger comes along – a recession, contagion through trade partners or a collapse in global risk appetite. Sound management softens the blow. In test runs 2000–2026 such crises occurred almost only in wealthy states (Spec 20 §16, prototype calibration runs).
Tips
- Infrastructure pays twice: it raises the efficiency of every building in a region.
- Stability is productivity: unstable regions produce less.
- Watch the bottleneck: one missing input slows a whole chain – first build what is missing, then expand what already works.
For now, suggestions go through the Discord channel or the community page.
Derived from the specifications; measurements come from test runs of the prototype and are marked as such.