Trade & logistics
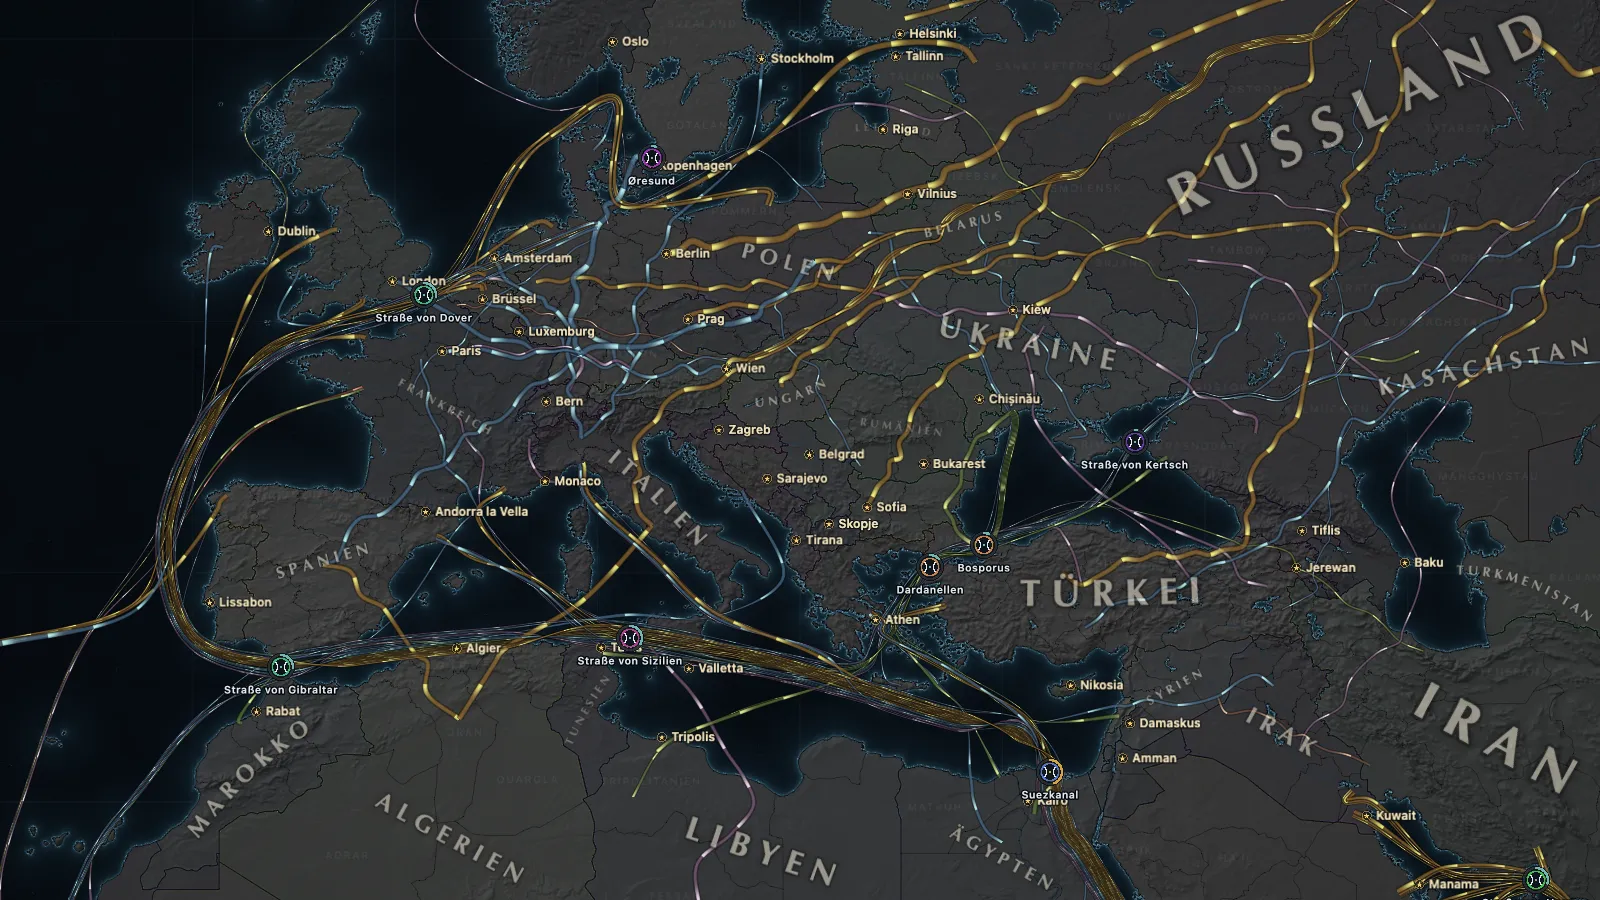
Whoever controls the routes sets the prices. In SOVEREIGN, flows of goods, chokepoints and embargoes are not numbers in a table – they are visible on the map.
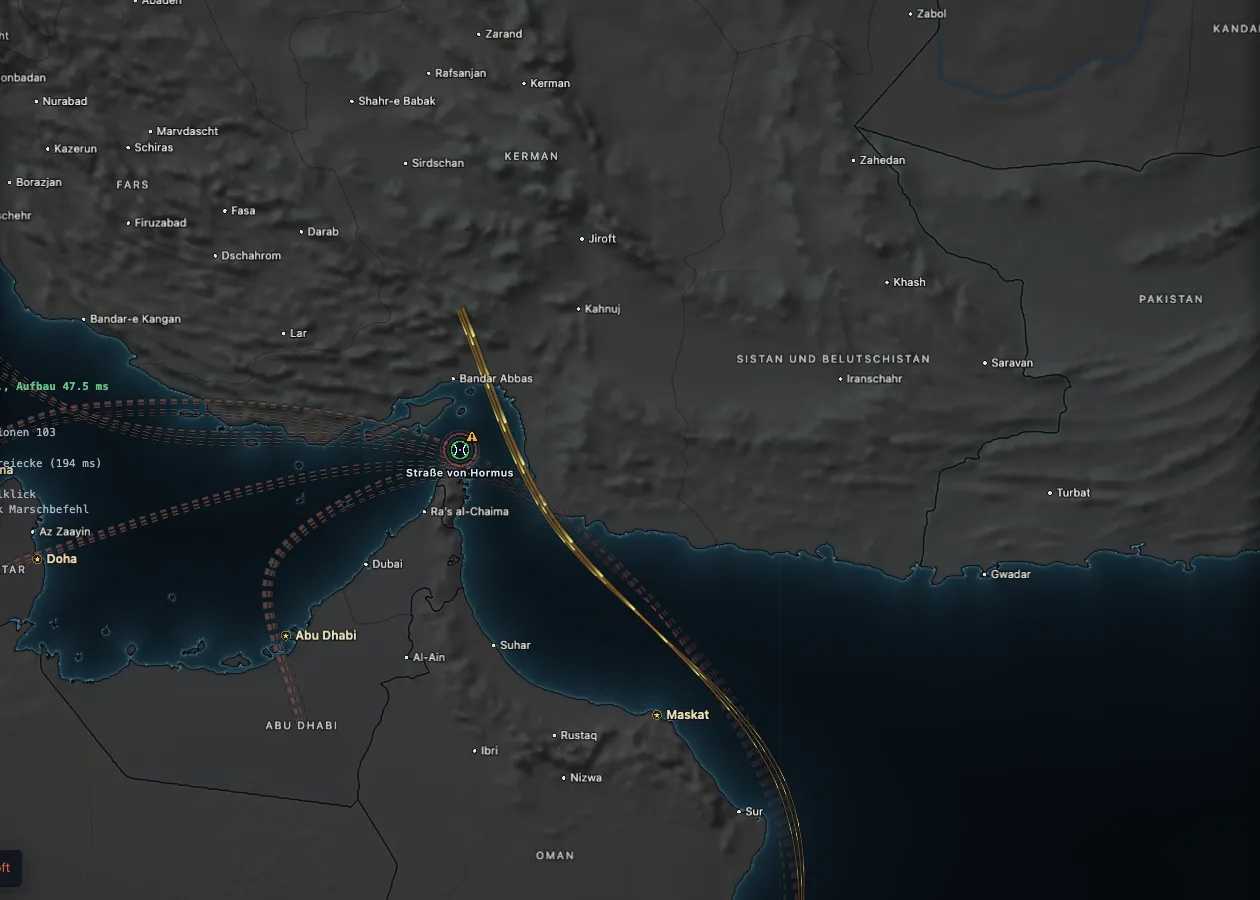
Ten chokepoints hold the map together.
Gibraltar, Dover, Øresund, Dardanelles, Kerch, Messina, Bonifacio, Suez, Bab-el-Mandeb and Hormuz – detected mechanically from the map. The trade map mode shows how much sea trade passes each strait – and who controls it.
- Convoys and capacity. Ports, rail stations and pipelines have throughput, the merchant fleet provides convoy capacity.
- Close, own, internationalise. Canals are megaprojects – buildable, closable, negotiable.
- Embargoes along real routes. Evasion through third countries is possible – and can be uncovered.
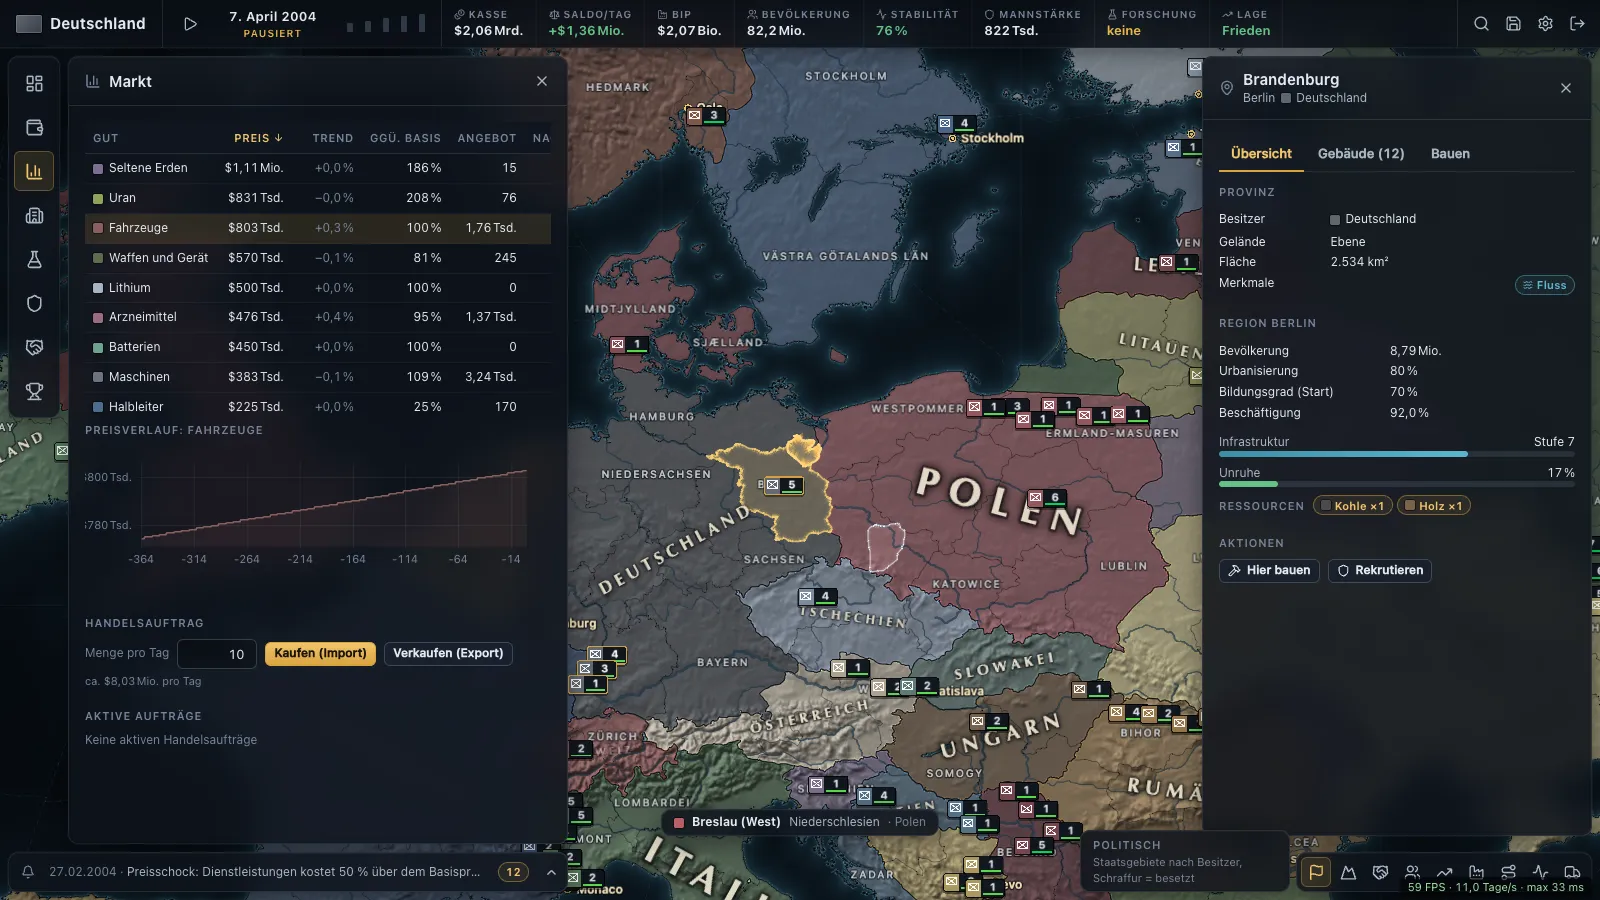
Prices with reasons.
Supply and demand per good, recalculated every week. The price chart names the main causes – for example “−18 % supply due to embargo”.
- 31 goods from grain to semiconductors, later hydrogen and computing power.
- Trade rules instead of busywork: “Buy oil when stock < 300 and price < X”.
- Economic areas: customs unions merge internal markets – with all political consequences.
One network for factories and fronts.
The same network supplies factories and fronts: capital → depot → railway → front depot → division.
Road & rail
Infrastructure levels determine throughput and supply range.
Sea trade & inland shipping
Convoys, ports, chokepoints. Naval warfare hits trade routes.
Pipelines & grids
Gas, later hydrogen and electricity. Submarine cables carry data – and can be sabotaged.
Climate and technology shift geography.
With rising temperatures and icebreaker capacity the Northern Sea Route becomes navigable. LNG terminals, land corridors through Eurasia and new pipelines shift dependencies.